
What makes a good app retention rate?

Prashansa Shrestha, Content Writer, Adjust, Apr 16, 2024.
Retention rates are a key indicator of mobile app health and user loyalty, offering insights into engagement and churn. Leveraging and mastering the most relevant analytics to your app, including retention rate, is crucial for driving growth and carving out a path to scalable and sustainable success. To help marketers thrive in the rapidly evolving mobile marketing landscape, we’re introducing a blog series focused on app metrics, the foundation of strategic app development and marketing.
This series will explore the most important metrics in-depth, highlighting their importance while thoroughly analyzing industry benchmarks, including a detailed breakdown across regions and verticals. We'll also share actionable best practices tailored to improve each metric's performance.
Let’s kick off our series with a spotlight on the all-important retention rates.
What are retention rates?
The retention rate measures the percentage of users who continue to use an app after installing it over a specific period. This metric allows app marketers to better understand when, why, and how users are leaving their apps and assess the app's performance over time. Since some categories outperform—and have different user cases from others- it's crucial to understand what a good user retention rate for your app's category is.
A high retention rate indicates that users are satisfied with the user experience (UX) and find value in your app, suggesting stronger engagement, which enables significant potential for monetization.
Retention rate analysis is often visualized through a cohort analysis over 30 days, and is inversely related to user churn. For example, a retention rate of 25% after 30 days would mean a churn rate of 75%.
What is the average app retention rate?
When analyzing your retention rate, look at how your user retention develops over 30 days. If you discover that retention significantly drops off at specific points (churn points) within that period, you should optimize to retain users beyond this date. For example, if you have a gaming app and notice that users often churn at the end of the onboarding period, you have identified a key area for improvement.
When discussing app retention rates, “day” is defined as a “period of 24 hours”. This means that two timestamps of when a user opens an app can be compared to determine if more than 24 hours have passed between them.
What is a good retention rate?
For an overview of daily performance, we calculated the median retention rates across all our verticals combined, broken out by platform. Despite being general, these figures can serve as a benchmark to assess how well your app’s retention rates are doing. Compare your retention stats with the following data to see how they stack up:
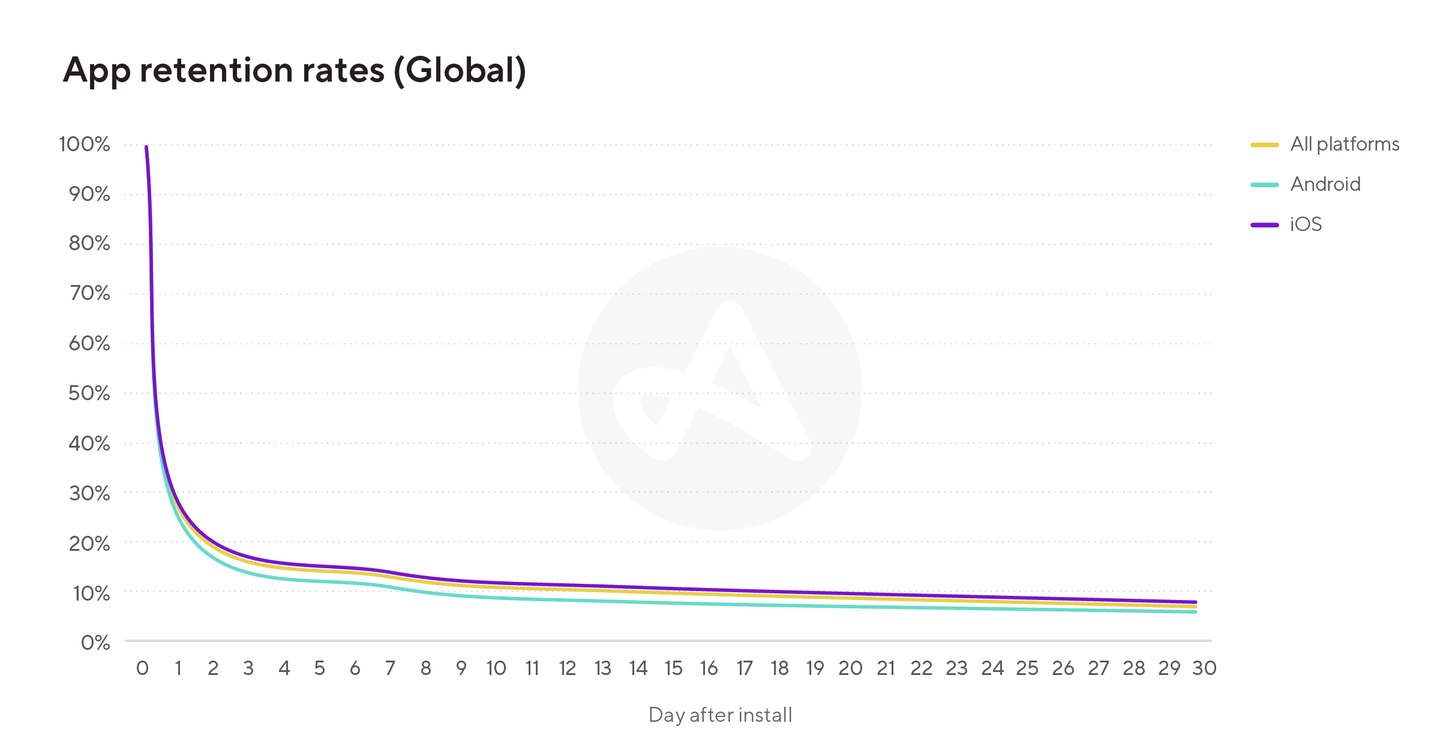
Overall, retention rates across all platforms and verticals drop to 26% on day 1. By day 7, they hit 13%, and by day 14, they sit at 10%. At the end of the 30 days, the rate settles at 7%.
The decline is slightly more pronounced for Android users, with a 24% retention rate on day 1, 11% on day 7, and 8% by day 14. By day 30, the Android retention rate is 6%.
iOS shows higher retention rates, with 27% on day 1, 14% on day 7, and 11% on day 14. By day 30, iOS maintains an 8% retention rate, suggesting that iOS users are more engaged—or stickier—over time.
Generally, an app is considered high-performing if it retains over a third of its users after install.
Retention rate breakdown by region
Now, we'll dive into median app retention rates by region, examining how users from different markets maintain user engagement over a 30-day period.
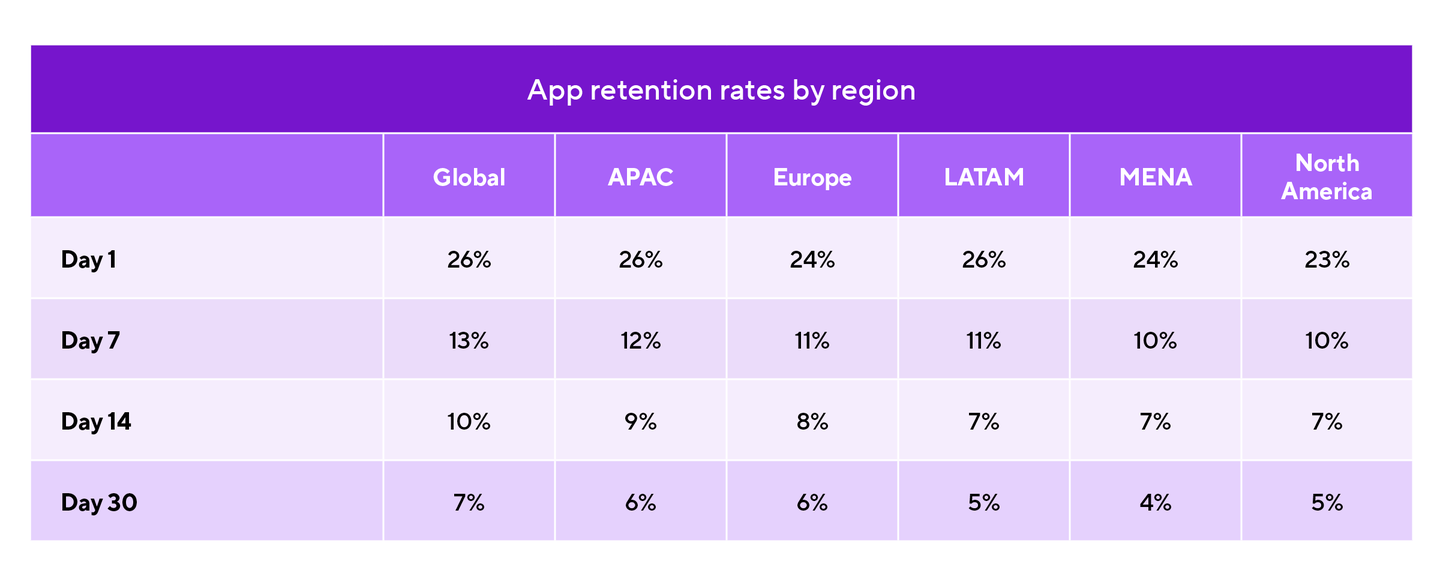
On day 1, the retention rate in APAC and LATAM matches the global rate of 26%. However, Europe and MENA had a slightly lower retention of 24%, with North America exhibiting the lowest at 23%.
By day 7, APAC still leads with a 12% retention rate, followed by Europe and LATAM at 11%. MENA and North America both drop to 10%.
On day 14, retention rates continue to decline, with APAC at 9%, Europe at 8%, and LATAM, MENA, and North America all at 7%.
By day 30, retention rates stabilize with APAC and Europe at 6%, LATAM and North America at 5%, and MENA showing the most significant drop to 4%.
It's noteworthy that APAC consistently outperformed the other regions despite similar starting points. Additionally, even though MENA started comparably to other regions, it saw the most significant drop by the 30-day mark.
Retention rate breakdown by vertical
We've analyzed global retention rates by vertical. This gives app developers and marketers an understanding of how well different app verticals retain users after installing an app. It’s essential to keep in mind that retention rates vary depending on the app’s category.

- Games and social apps lead the pack: With day 1 retention rates of 29%, gaming and social apps are the clear front-runners. This is expected since these apps are highly engaging and easily integrated into users' daily routines and social habits.
- Health & fitness keep users hooked: These apps also perform well, boasting a 27% retention rate on day 1. As users integrate these apps into their lifestyle changes and daily routines, it significantly increases user engagement.
- Fintech apps have potential: Fintech apps have an average day 1 retention rate of 22%. The decision to manage finances through a new platform often requires commitment from users, likely contributing to this relatively high figure.
- Entertainment and utility apps remain consistent: Both categories display similar day 1 retention rates at 20% and 21%, respectively.
- Shopping and travel have room for improvement: With 18% and 16% retention rates, shopping and travel apps are at the lower end of the range. These lower figures may be due to quick goal completions, such as making a purchase or high competition. Improving UX and implementing re-engagement strategies could increase these rates.
- A strategic pivot needed for food & drink apps: With a day 1 retention rate of 13%, food & drink apps need to catch up. The numerous choices available to consumers may lead to decreased loyalty and lower retention rates.
Retention rate breakdown by region and vertical
We've also analyzed app retention rates by industry verticals and regions on the first day after install. These data points are crucial, providing insight into user behavior and preferences across different markets.
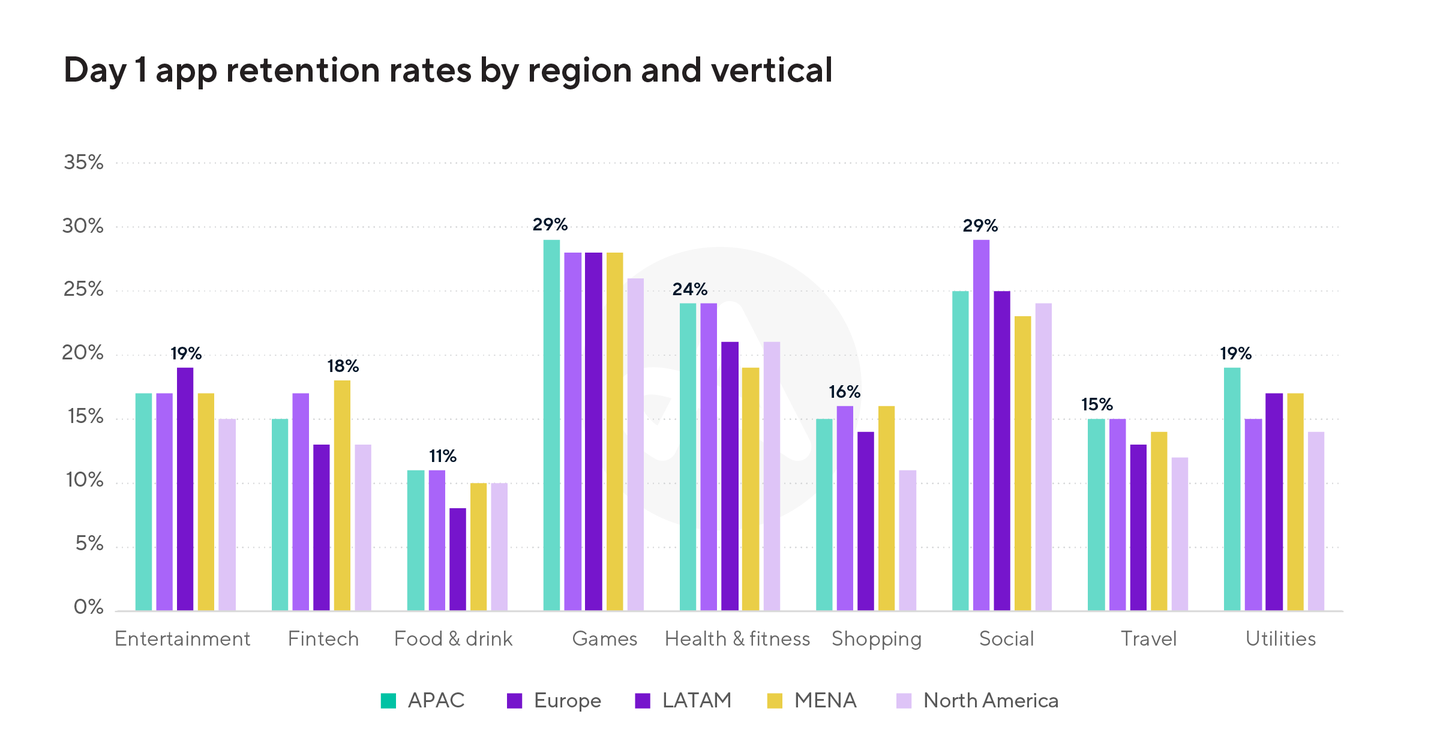
- Gaming reigns supreme: Games maintain the highest retention rates at around 28-29% across all regions. The lowest rate is 26% in North America, which is still impressive compared to other app categories.
- Fitness across the board: Health and fitness apps show strong retention in APAC and Europe at 24%, dipping slightly in LATAM and MENA and holding at 21% in North America.
- Varied appeal of social apps: Europe leads with a 29% retention rate for social apps, slightly higher than other regions. APAC and LATAM follow with a 25% day 1 retention rate, while North America and MENA trail at 24% and 23%, respectively.
- Higher utility use in APAC: Utility apps see the highest retention in APAC at 19%, followed by LATAM and MENA at 17%, Europe at 15%, and North America at 14%. This might indicate a higher reliance on utility apps and effective localization of these apps in APAC.
- Slow start for food & drink: This vertical has the lowest retention rates, around 10%-11% across regions. LATAM has the lowest retention rate at 8%. Region-specific taste preferences and the availability of local options might affect this category's user retention.
- Moderate performance of fintech apps: In this vertical, MENA shows the highest day 1 retention rate of 18%, followed by Europe at 17%, APAC at 15%, and LATAM and North America at 13%.
- Average rates for entertainment apps: Entertainment apps chart a day 1 retention rate ranging from 15% to 19%. While LATAM has the highest retention rate of 19%, North America has the lowest at 15%. This suggests that this vertical has room for improvement across all regions for
- Shopping apps need a boost: For this category, day 1 retention rates range from 11% to 16%, with Europe and MENA having the highest retention at 16% and North America the lowest at 11%. Shopping apps must invest more in personalization and targeted promotions to increase user retention.
- Travel apps need a push: With retention rates ranging from 12% to 15% across regions, APAC and Europe have the highest retention rate of 15% and North America the lowest at 12%.
Best practices to improve mobile app retention rates
If you've looked at our overview and are still looking for a performance match, it may be worth reviewing our tips below on improving retention. From onboarding to messaging, here are several suggestions to keep users returning even weeks after install.
Enhance user experience with optimized onboarding
As seen in numerous benchmark reports, most users tend to leave between day 0 and day 1. Therefore, acting during this period is the best chance to keep them around. First impressions matter, so ensure that your app onboarding experience is incredible from the start.
Your app's onboarding process should be intuitive and highlight the benefits of using your app from the get-go. An onboarding experience that is easy to navigate and clearly presents your app's value is key to keeping new users engaged. Moreover, simplifying the onboarding journey encourages users to explore your app further and discover features they might have missed.
Personalization
From location to user preferences, there are many ways to create unique experiences for different users to keep their attention. Segmenting your users into cohorts can help you personalize their app experience strategically and analyze each cohort's behaviors and preferences, leading to more effective retargeting.
You can tailor push notifications and in-app messages to your user segments, encouraging users to log back in when they're most likely to interact with your app. However, avoid bombarding users with notifications. Additionally, tailoring your content can help you gain more loyal users. Remember, there are two types of personalization:
- Static personalization includes constant factors, like the user's name in push notifications.
- Dynamic personalization includes factors that change, like behavior or conversion history.
Learn more about how Adjust Automate can make your operations more efficient and your budget more effective.

Focus on re-engagement messaging
Optimizing your creatives for diverse app users can significantly improve your retention rate. Engage your platform's audience in your messaging by sharing user stories or introducing competitive ranking tables. Initiate consistent, value-driven re-engagement campaigns tailored to the user, starting within a week of the install and continuing throughout the customer's lifecycle.
Additionally, sending a compelling reminder to inactive users outside the app can effectively re-engage them. These reminders can be sent via email, social media, and search ads. It's crucial to utilize data insights on the inactive users’ behaviors, interests, and preferences to make sure your remarketing campaign is relevant and effective.
Identify bottlenecks for a seamless user experience
There are pain points in almost every app experience. Pinpointing and improving those moments when users leave can help boost your retention rate. It’s essential to find these retention barriers and overhaul them. If many users churn at the same point, your data analysis reveals a key area for improvement.
A/B test campaigns and features to learn user preferences
Testing is an effective way to determine if your efforts will produce the desired outcomes. A/B testing, specifically, can help you refine your marketing campaigns for greater efficiency and identify the messaging and features that boost engagement and conversions.
When introducing a new feature, A/B testing is an excellent strategy to understand whether your users will welcome the new addition or cause them to churn. By testing your latest feature on different segments, you can find out if any feature or messaging needs to be reworked before a full-scale rollout.
Check out our ultimate list for more innovative A/B testing ideas to boost your mobile app growth.
Gamify user experience
While acquiring new users is also crucial, it's equally, if not more important, to value and reward your existing users for their loyalty. This is where gamification of the UX comes into play. Adding game mechanics to non-gaming UX can significantly increase user retention. Gamification leverages user motivations like task completion, competition, and social recognition. You can implement gamification by incorporating elements like challenges, badges, points, levels, and in-app currency, encouraging users to engage with your app consistently.

Improve engagement through feedback
To keep users engaged and interested in your app, listening to your users’ feedback is essential. For instance, you can send out surveys to your target audience(s) to understand their experience with your app and if they would recommend it to others.
Another valuable feedback source is the app store's ratings and reviews. Users often use these platforms to express their views or rate apps, so leverage these reviews on Google Play or the Apple App Store to improve your app.
Feedback is also about constructive criticism. If your users point out specific issues with your app, it's an opportunity for you to work on that gap. Recognizing and addressing these problems will enhance the user experience with your app, as there's always room for improvement.
Track more metrics
While the retention rate provides an overview of user engagement in your app, it doesn't tell the complete story. A range of metrics should be tracked and analyzed for a comprehensive understanding of user engagement. These include active daily users, churn rate, lifetime value (LTV), a range of revenue metrics, and many more
For more information on increasing user retention with more insights, examples, and strategies, check out our guide — User retention: How to successfully keep users and grow your app. To learn how to measure your app’s success and how users interact with your app, request a demo with Adjust today.
Be the first to know. Subscribe for monthly app insights.