

Short drama apps, season two: Q3 2026 data on growth

Time in short drama apps has grown fast since early 2025. Sensor Tower measured average daily use at 25 minutes globally in April 2026, up 85% from January 2025, while OTT streaming stayed flat at around 35 minutes.
In this article, we analyze Adjust data to look at how short drama installs and sessions changed from Q1 to Q3 2026 and which regions grew fastest. It also covers how viewing time builds in the days after install, which shows when users do most of their watching.
Sessions and installs continued to grow
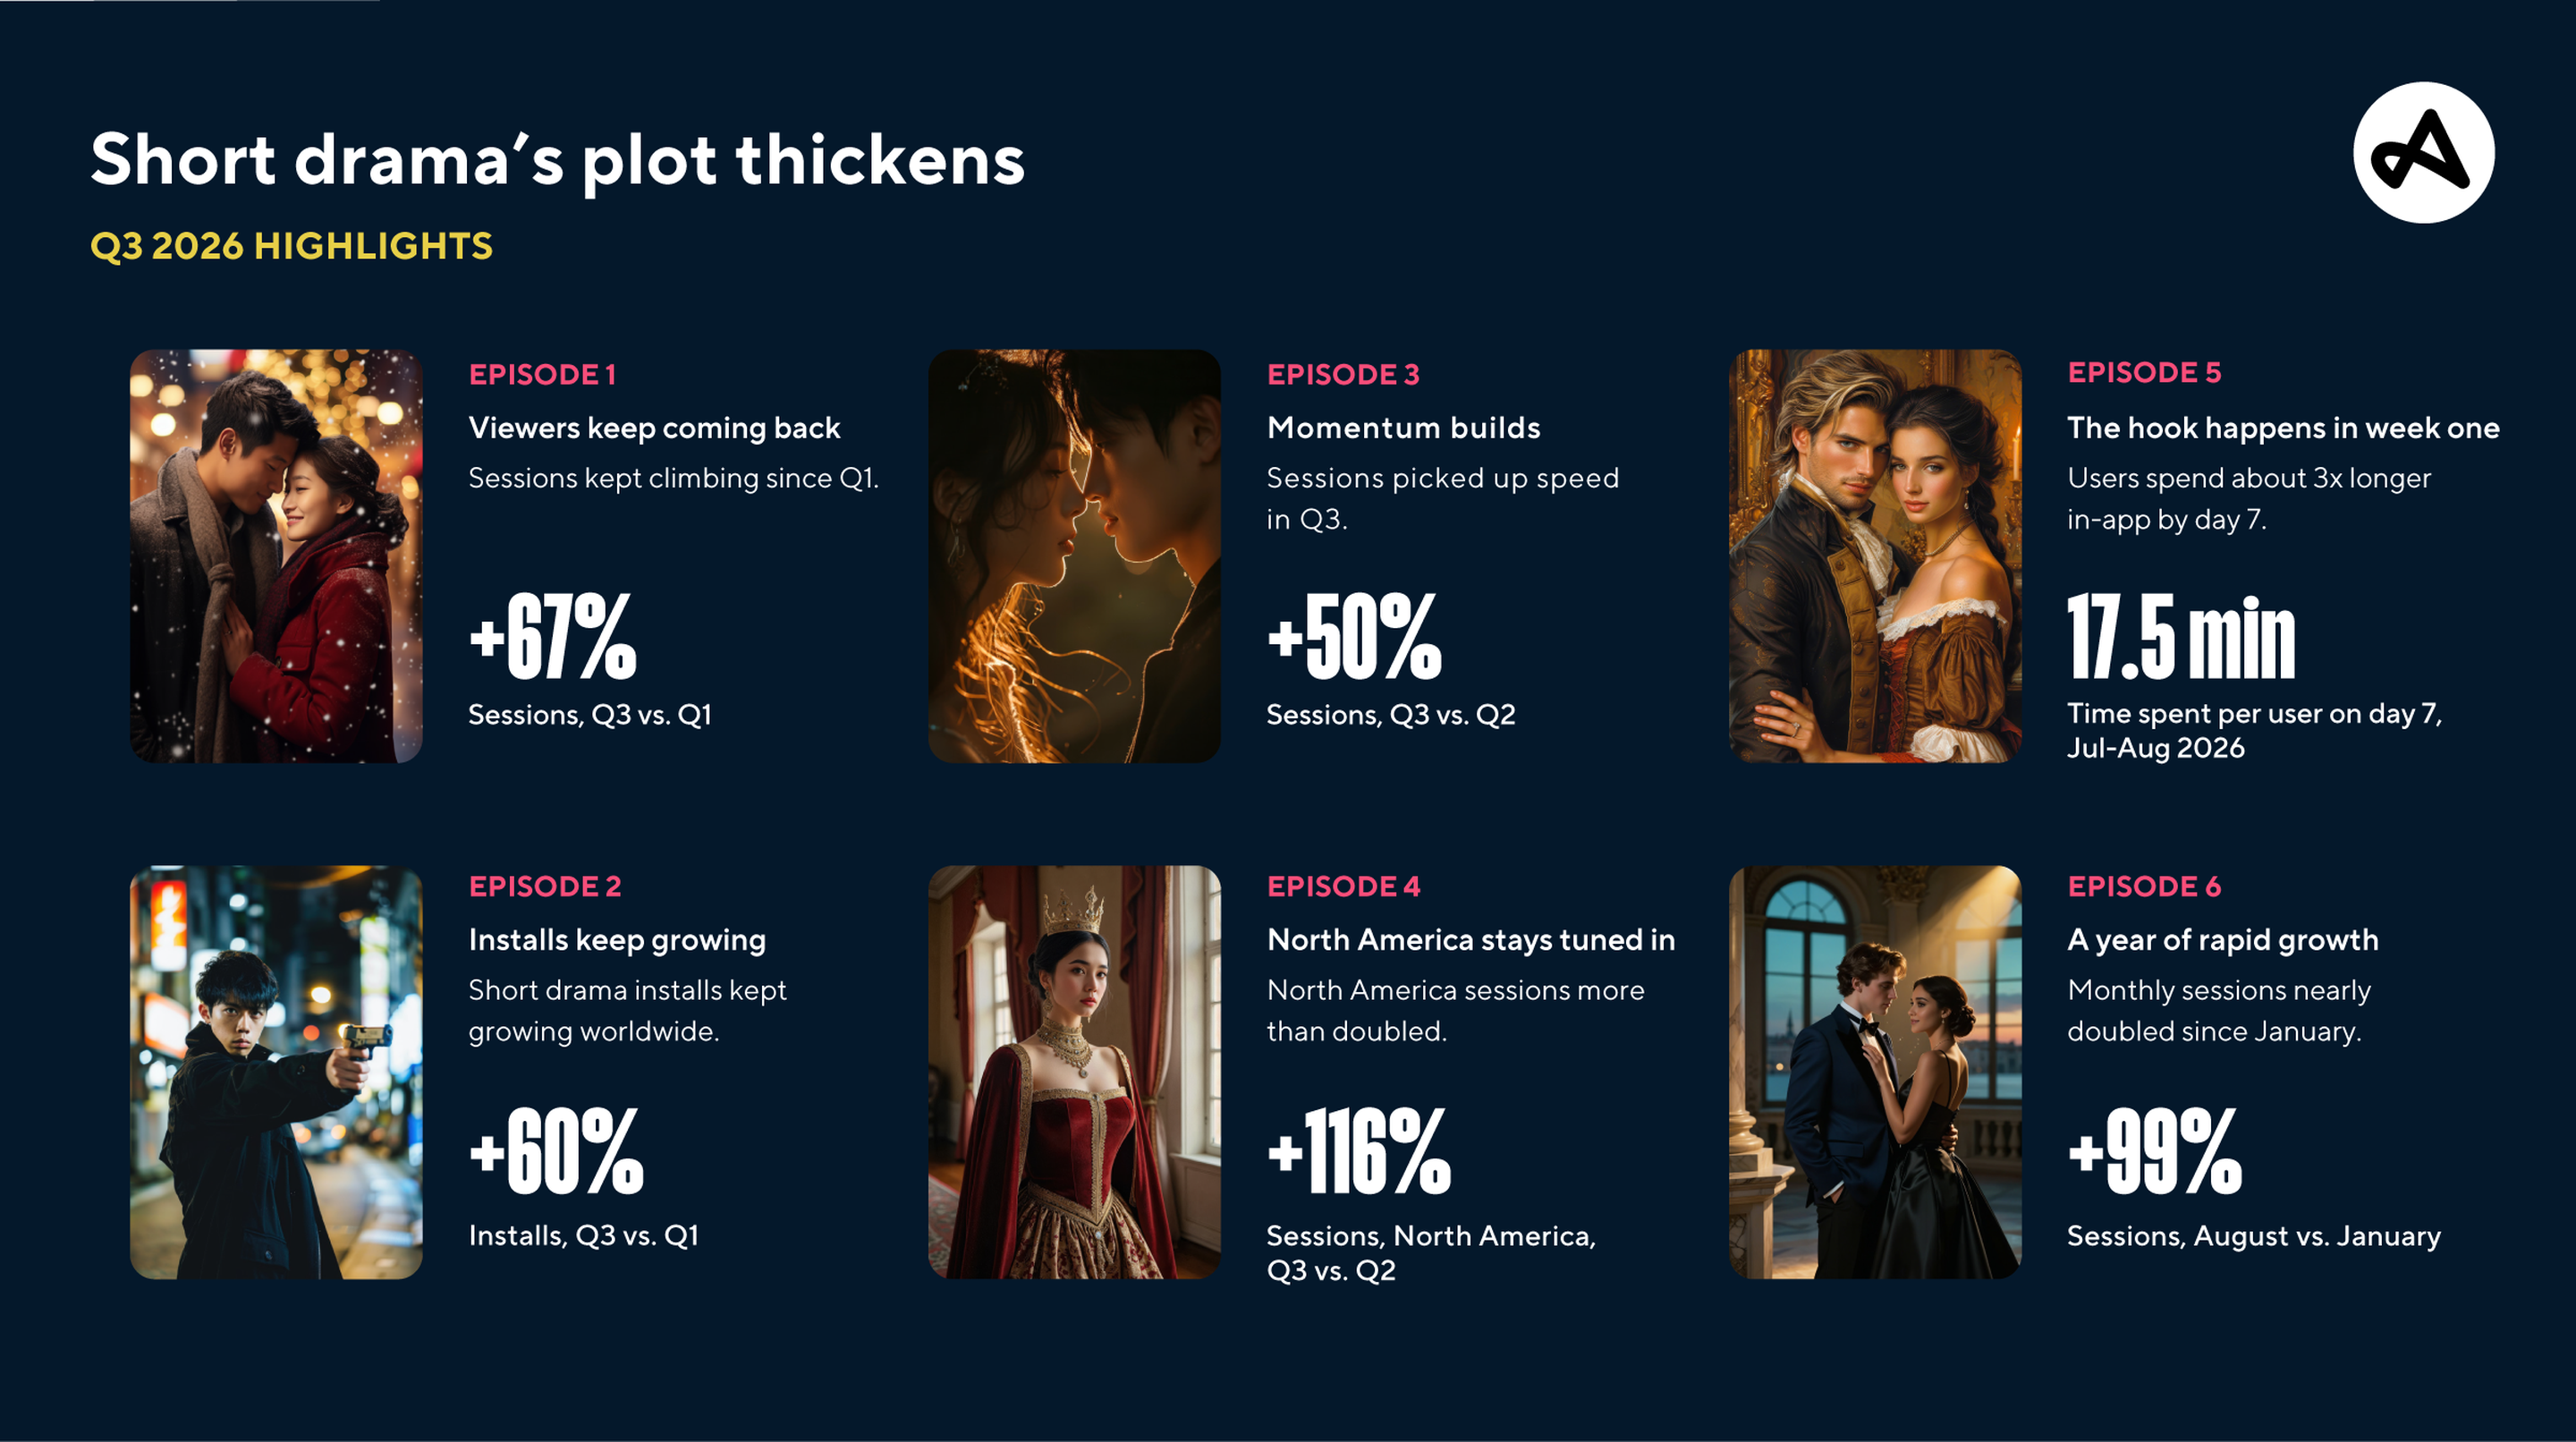
Globally, short drama sessions rose 67% from Q1 to Q3 and 50% from Q2 to Q3. Installs grew 60% over Q1.
When comparing months, sessions in August were 99% higher than in January, close to double.
North America leads on session growth
In Q3 North America grew sessions fastest, up 116% compared to Q2 and 267% to Q1. Its installs rose 23% in Q3 vs. Q1. Europe and MENA followed, each up 128% in Q3 vs. Q1. APAC grew similarly, with sessions up 65% and installs up 59%.
Q3 growth by region
LATAM sessions only increased 36% in Q3 compared to Q1. It is also the only region where installs (up 55% on Q1) grew faster than sessions. Sensor Tower’s Q1 data shows why the market is worth watching. Latin America accounted for 23% of global short drama downloads, behind Southeast Asia at 32% and ahead of India at 22%. In a market that size, it is worth checking which campaigns bring users who keep watching.
Viewing time builds over the first week
New users spend little time in a short drama app on install day and a lot more by day 7. In July and August, an active user spent 5.9 minutes in the app on day 0 and 17.5 minutes on day 7, about three times as much. The year to date (YTD) data shows the same pattern, with time per user rising from 8.5 minutes on day 0 to 21.6 on day 7.
After day 7, time decreases but stays above install-day levels. In Q3 it fell to 13.6 minutes on day 14 and 10.7 on day 30. The YTD figures were 17.8 and 14.
Engagement per user per day (Global)
Sessions per user per day stay around 1.4 a day throughout, so the extra time comes from longer viewing sessions, not from users opening the app more often.
What the data means for marketers
Marketer interest is high. In the survey behind our Q1 report, 67% of app marketers said they advertise in short drama apps or want to test the channel.
Time per active user is highest on day 7, so a campaign should be judged on what its users do in that first week, not on installs alone. Adjust Measure follows users past the install, which lets you compare channels and campaigns on week-one behavior and not just cost per install.
Viewing time drops between day 7 and day 14 in both datasets, which makes it a sensible point to bring users back. Pulse alerts can flag a change in a metric you track, such as day 7 retention, so you can send a message while a user is still around. TrueLink can then take that user straight to a specific screen, such as the series they stopped watching.
For the Q1 benchmarks by region, download The short drama apps report. To learn more about how you can measure what your users do after install, request a demo.
Be the first to know. Subscribe for monthly app insights.
Keep reading
